February 6, 2026
The speed of information determines the quality of financial decision-making. In today’s banking and fintech environment, the monthly close cycle or preparation for an executive committee still faces a critical obstacle: data latency.
Chief Financial Officers (CFOs) and FP&A (Financial Planning and Analysis) leaders spend a disproportionate amount of time collecting and cleaning data, reducing their capacity for strategic analysis. Dependence on technical teams to extract information from complex databases creates bottlenecks that slow responses to market volatility.
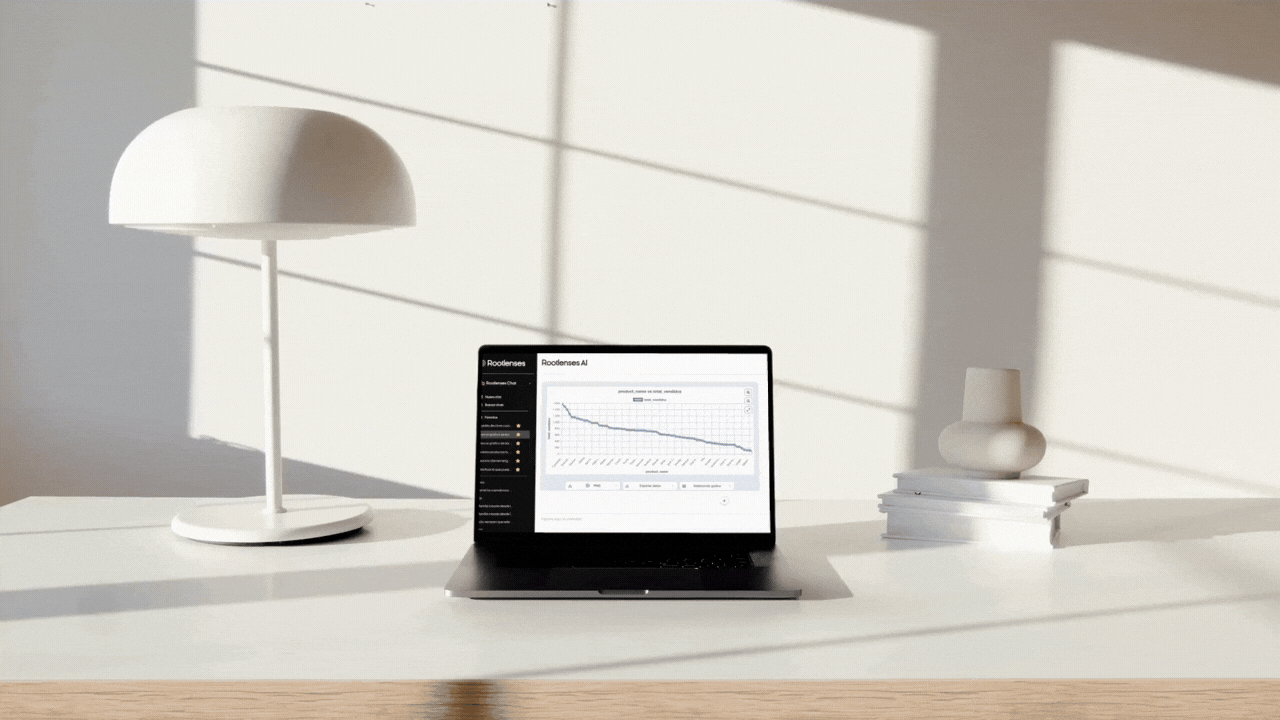
The solution lies in the integration of AI-powered reporting. Tools like Rootlenses Insight act as an intelligence layer that allows users to query data directly, eliminating technical friction and automatically generating visualizations ready for executive leadership.
What financial leaders need today from an executive report
An effective executive report is not simply a lengthy spreadsheet. For a CFO or Head of Financial Planning to take action, the information must meet three key criteria:
- Immediacy: Data must be available in real time. A report based on last week’s data quickly loses relevance for treasury management or intraday risk monitoring.
- Clear visualization: Trends, deviations, and anomalies must be visible at a glance. Dense financial tables should be complemented with charts that enable rapid interpretation.
- Actionability: The report must answer a specific business question, enabling immediate corrective or strategic action.
The goal of AI-driven financial analytics is to transform raw databases into these three components without manual intervention.
Limitations of traditional reporting in banking and fintech
Despite investments in digital transformation, many reporting processes in financial institutions remain inefficient. Traditional workflows present structural limitations:
- Static dashboards: Traditional Business Intelligence (BI) tools are effective for monitoring predefined metrics. However, when executives need answers to ad-hoc questions (e.g., “What is the variation in financial margin by branch in the northern region compared to Q3?”), static dashboards fall short.
- IT dependency: To obtain specific answers, finance teams must request reports from data or IT teams. This process involves support tickets, waiting times, and often iterations due to misunderstood requirements.
- Manual Excel manipulation: Once data is delivered, financial analysts must consolidate, clean, and format it manually, increasing operational risk due to human error.
These frictions prevent truly agile data-driven decision-making.
What it means to create executive reports “instantly”
Creating reports instantly means eliminating technical intermediaries. It means business users—financial executives—have direct access to the single source of truth without needing SQL or programming knowledge.
Rootlenses Insight functions as an executive reporting assistant. It connects relational databases (MySQL, SQL Server, Postgres, Oracle) to a natural language chat interface.
Immediacy is achieved because the platform analyzes and understands data schemas and context without prior human training. Users ask complex financial questions, and the AI securely interprets the request, executes the query, and returns results within seconds.
How Rootlenses Insight automatically generates tables and charts
A key differentiator of Rootlenses Insight for the financial sector is its dual approach to presenting results: numerical precision and visual clarity.
When a user submits a query, the system does more than return a single data point. It automatically generates a complete reporting structure:

1. Detailed financial tables
The platform structures responses into organized tables. For example, when querying operating expense (OpEx) breakdowns by category, Rootlenses presents rows and columns with exact values—critical for auditing and financial validation.
2. Automatic charts
At the same time, the AI determines the most effective way to visualize the information.
- If the query involves a time-based trend (e.g., NPL evolution – Non-Performing Loans), it generates a line chart.
- If it involves category comparisons (e.g., portfolio distribution by product), it generates bar or pie charts.
- No manual configuration: Users do not need to select axes or configure colors; the system handles this automatically based on data characteristics.
3. Export and formats
To support board presentations or deeper analysis, both tables and charts are fully exportable.
- Data: Download in CSV format for financial modeling.
- Visuals: Download in JPG or PNG formats for direct insertion into presentation slides.
Use cases: AI-driven financial analytics in action
The application of automatic charts and natural language queries spans multiple critical areas of financial management. Below are real-world use cases where the platform delivers immediate value.
Profitability and performance analysis
A Head of Finance needs to assess business unit performance before a monthly meeting.
- Query: “Show me net profit by financial product for the last quarter and compare it against budget.”
- Result: A comparative table with percentage variances and a grouped bar chart showing Actual vs. Budget.
Risk management and collections
Risk teams need to monitor credit portfolio quality.
- Query: “List the top 20 customers with the highest credit exposure and delinquency greater than 30 days, grouped by branch.”
- Result: A detailed table with names, balances, and days past due, along with a geographic distribution chart of risk exposure.
Treasury and cash flow
For daily liquidity management.
- Query: “What is the average daily balance of deposit accounts over the last 15 days?”
- Result: A time-series line chart showing liquidity fluctuations and a table with daily balances.
Strategic benefits for financial leadership
Implementing Rootlenses Insight as an intelligence layer over corporate databases delivers clear competitive advantages for banking and fintech organizations.
- Financial team autonomy: Analysts and executives regain control of their data, reducing dependency on technology teams for routine or exploratory queries.
- Security and governance: Unlike sharing spreadsheets via email, Rootlenses maintains end-to-end security. It integrates with existing security protocols and supports role-based access control (RBAC), ensuring users only see data relevant to their authorization level.
- Operational efficiency: Reporting wait times are eliminated. Analysis cycles accelerate, allowing rapid iteration of questions and answers within a single working session.
The future of financial reporting is conversational
The evolution of enterprise management tools is moving toward natural interaction. Financial leaders should not need technical translators to understand the health of their business.
The ability to generate executive financial reports through fluid conversation with data defines the new standard of efficiency.
Tools like Rootlenses Insight do more than automate charts and tables; they enable a culture of transparency and speed that is essential in the modern financial ecosystem.
Data-driven decision-making stops being a slogan and becomes a daily operation—executed in seconds, with precision and visual clarity.
